Farmland as

a strategic asset 

A heatmap matrix displaying correlations between different asset classes, including private capital, buyout, fund of funds, early stage venture capital, expansion venture capital, natural resources, S&P 500 total return, Russell 2000 TR, MSCI US REIT TR, MSCI World TR, real estate, private debt, and farmland. The matrix uses varying shades of green to indicate the strength of the correlation coefficients, with values ranging from 0.02 to 1.00.

Expanding the Efficient Frontier through

Permanent Crop Allocation

Hillside landscape with rows of small trees and a few taller trees under a partly cloudy sky.
Colorful circular diagram with missing asset in the center labeled 'Missing Asset (Should Be Included)' and surrounding segments representing various investment categories such as venture capital, private equity, real estate, natural resources, and stock market indices.

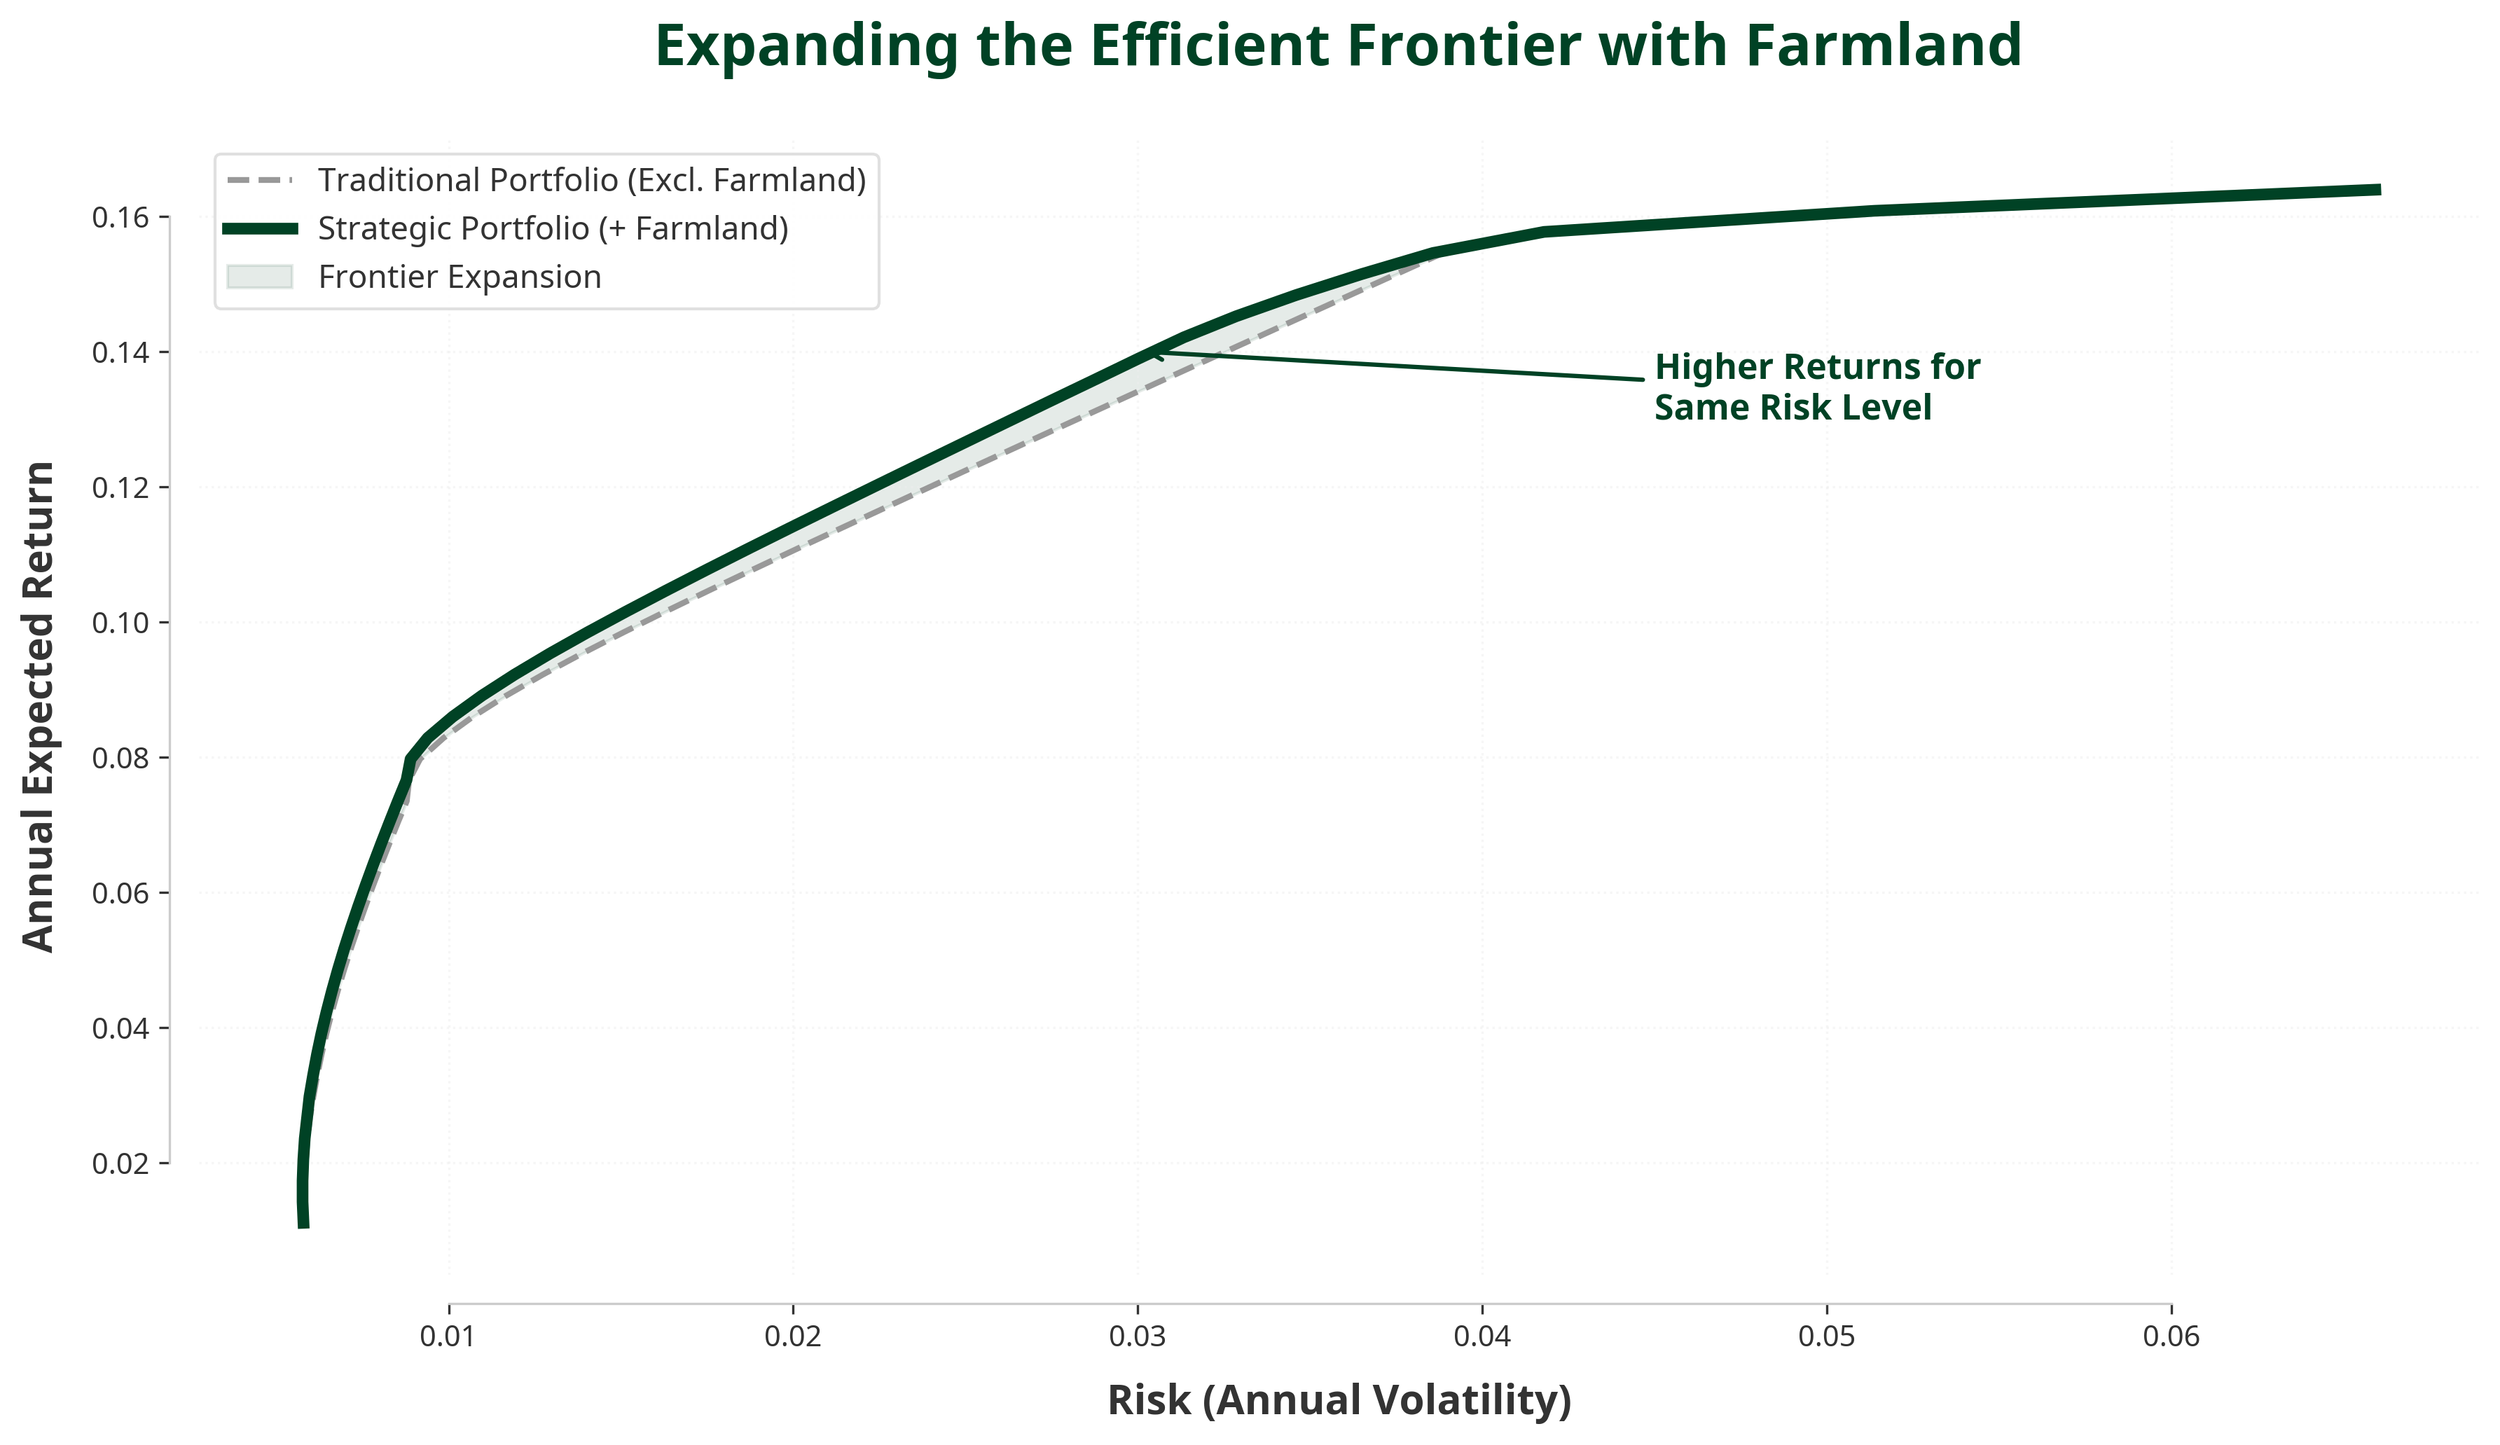
Traditional Portfolios Carry Uncompensated Risk

Our analysis reveals that the average portfolio sits below the Efficient Frontier. This means investors are carrying more risk than necessary for the expected return.

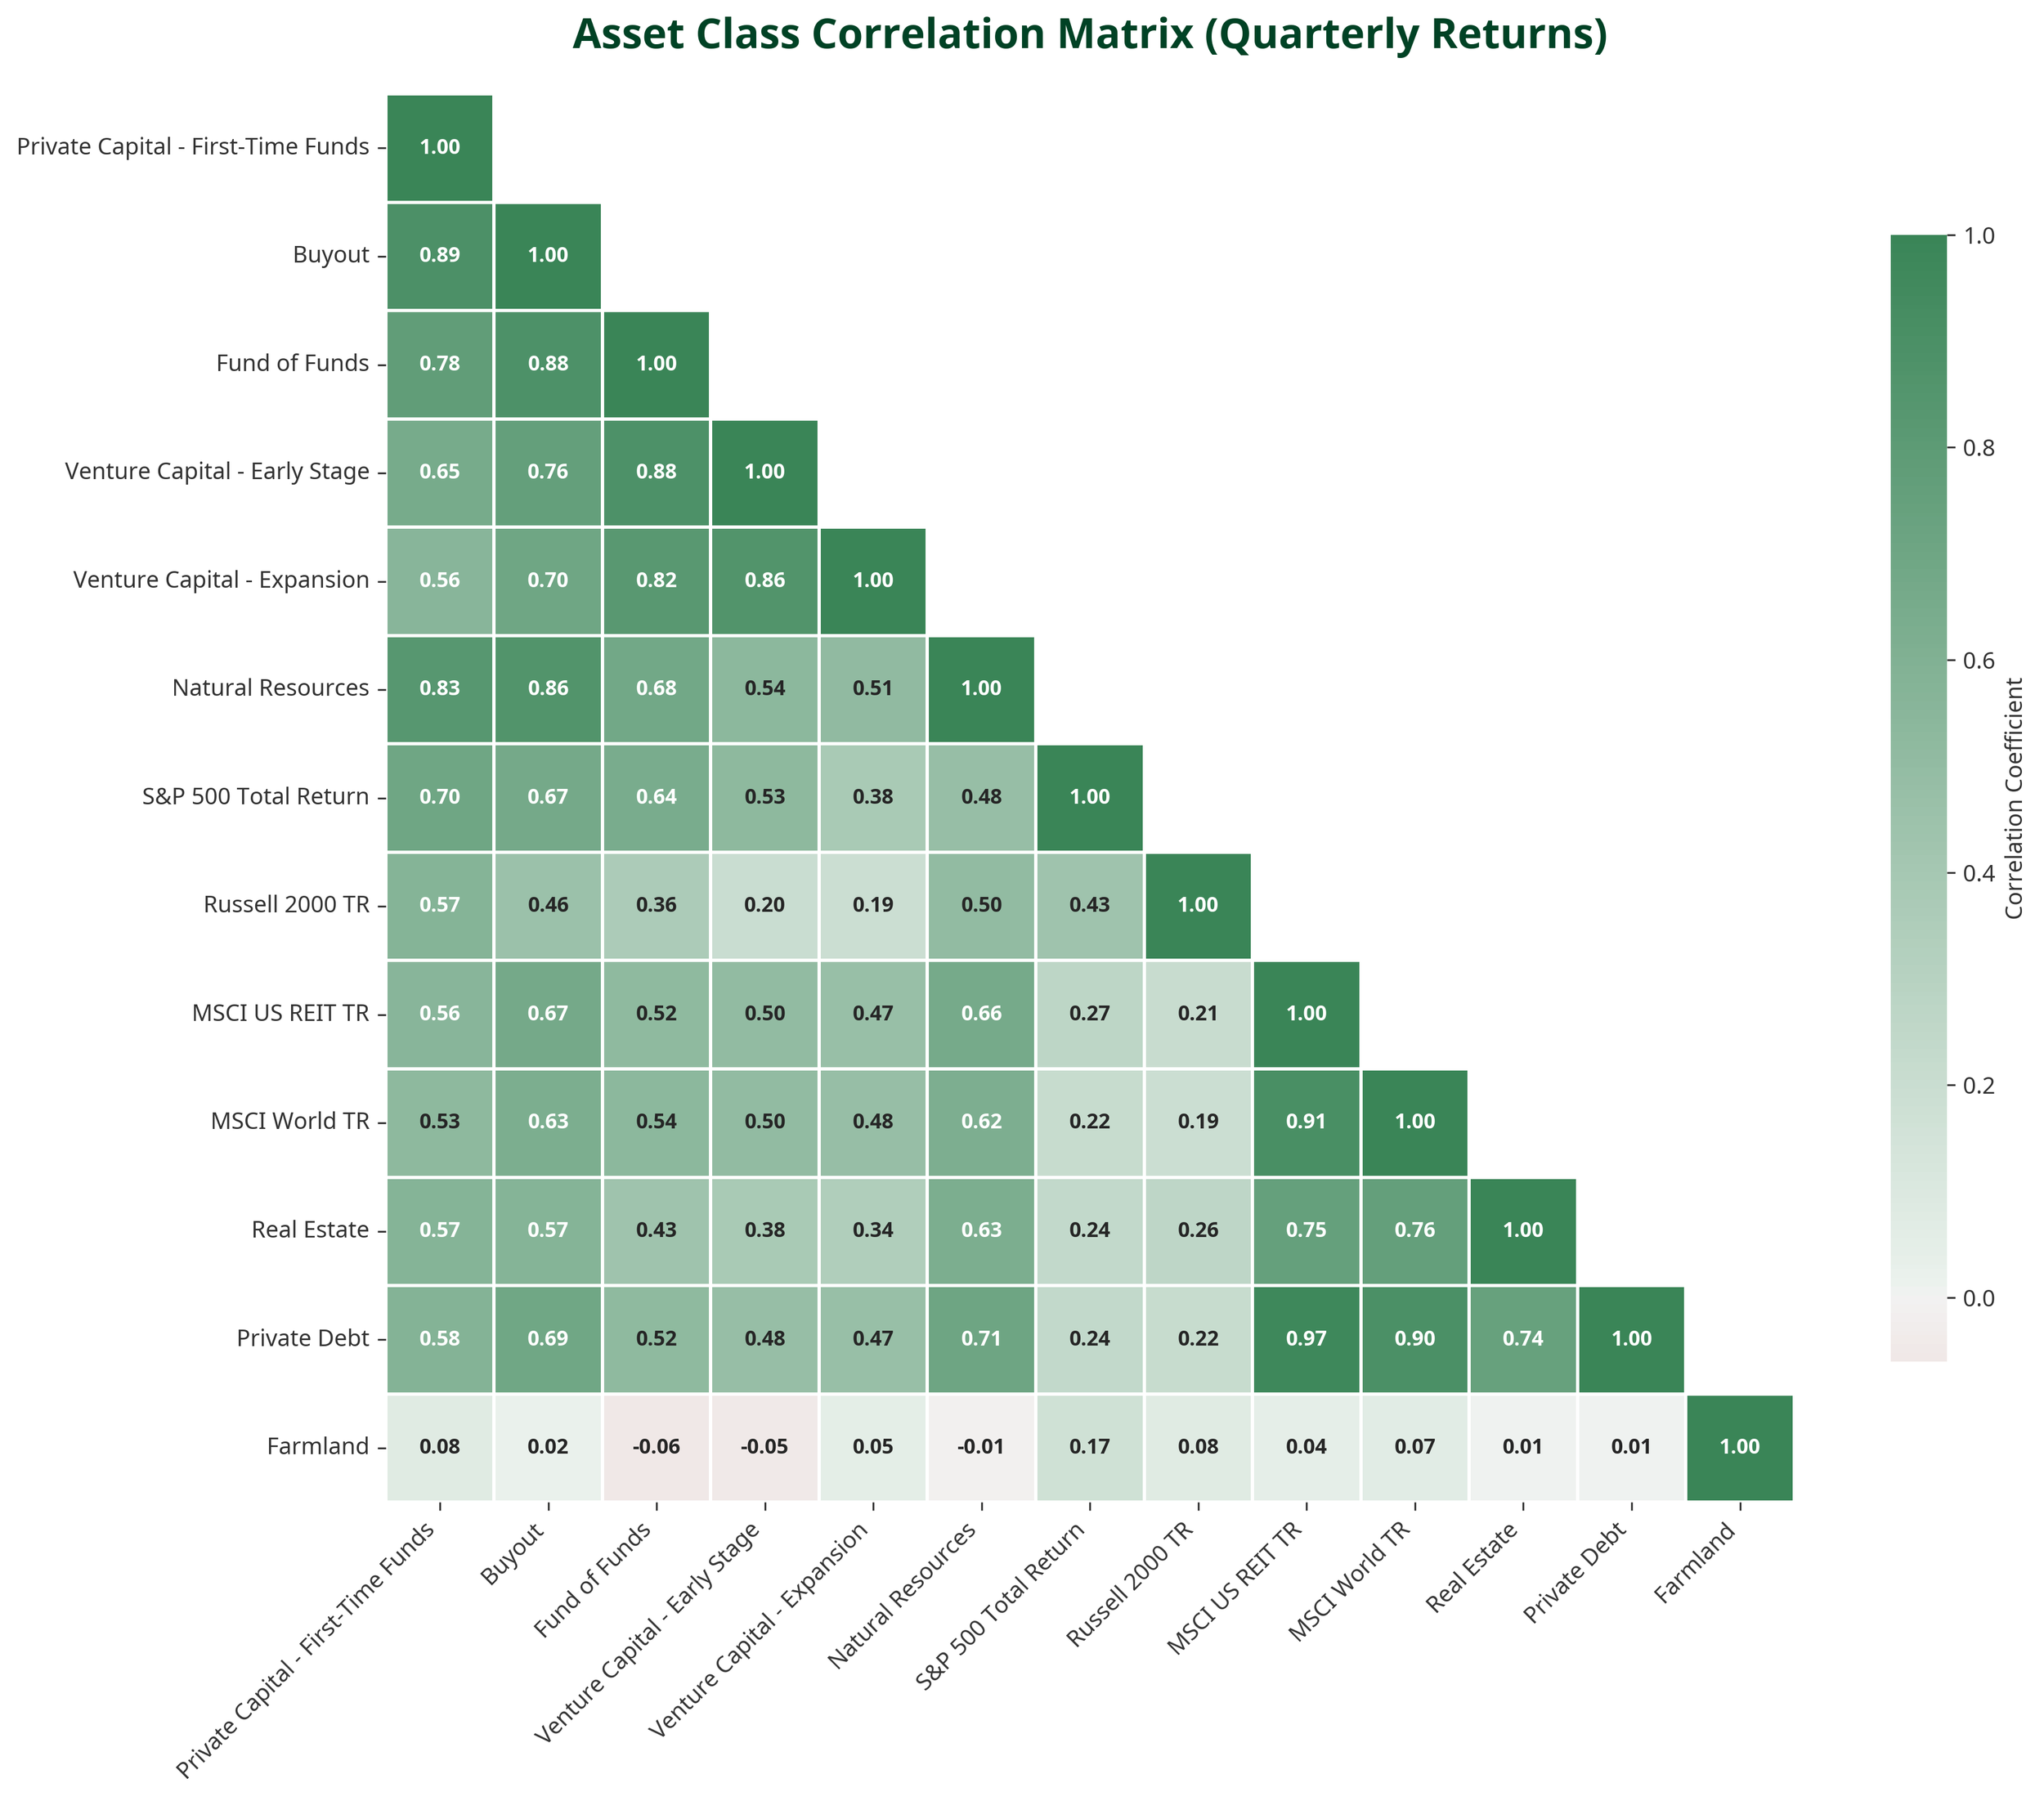
Traditional assets (equities, bonds, and real estate) move together, especially during market stress. This high correlation concentrates risk without proportional reward.

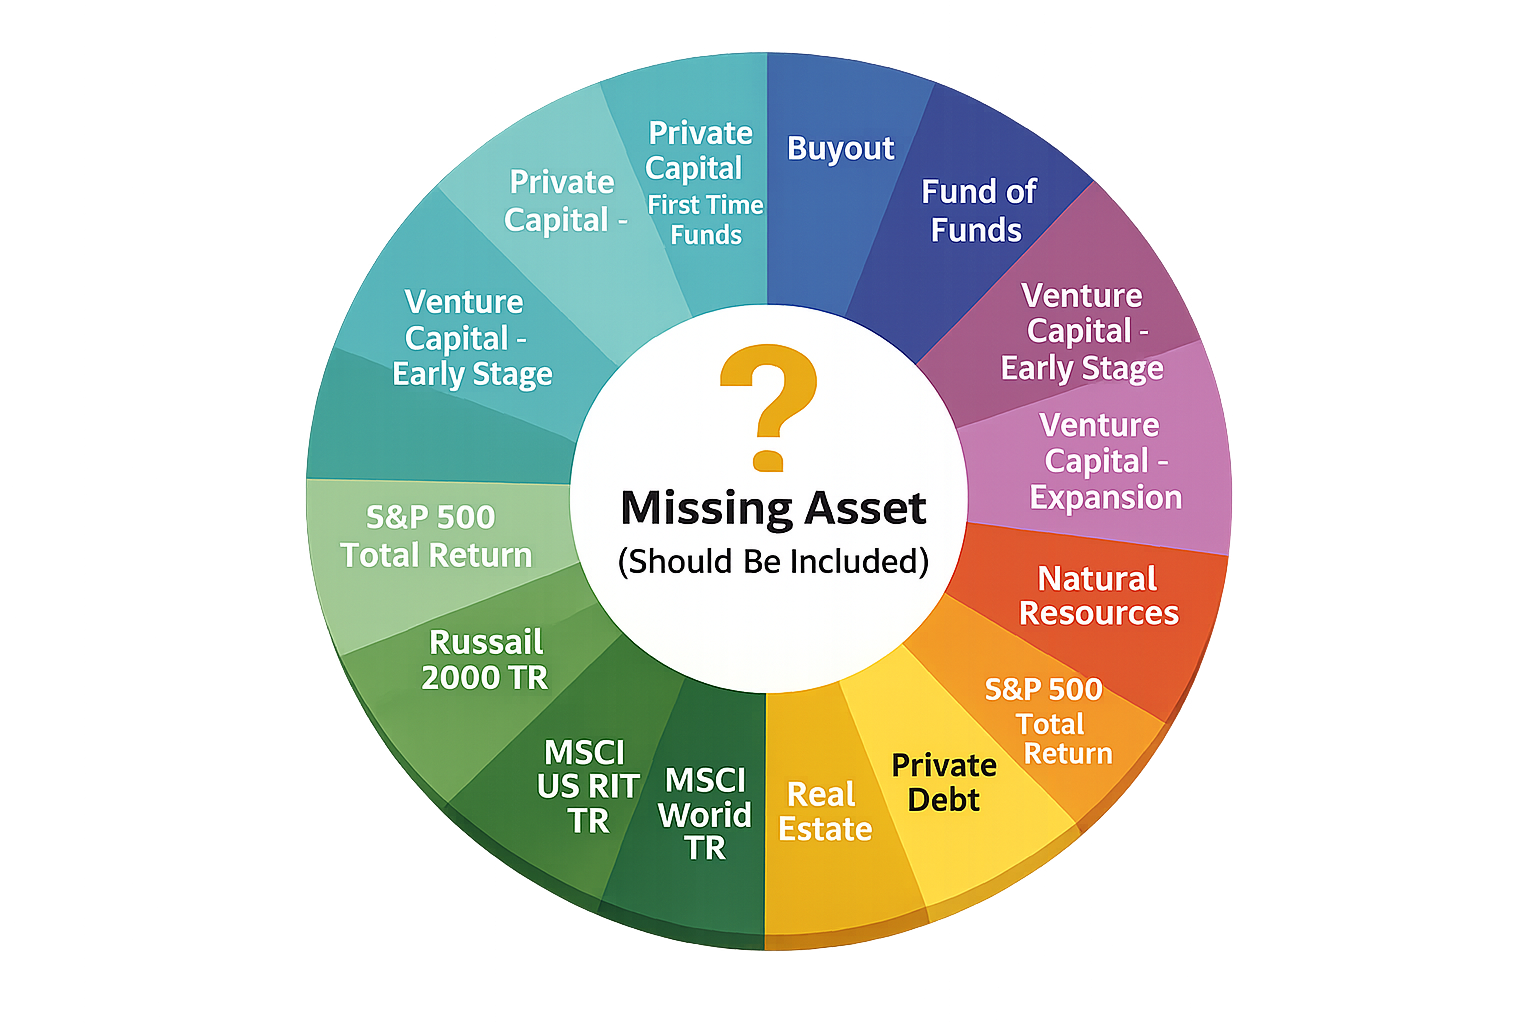
What single asset can shift the Efficient Frontier upward and to the left?

Strategic Integration of Farmland for Optimal Portfolios

Farmland, particularly permanent crops, provides this solution, offering superior risk-adjusted returns.

The challenge for wealth managers is no longer whether to include farmland, but how to implement it strategically.

By embracing this strategic approach, investors can effectively expand their Efficient Frontier and achieve a more resilient, risk-adjusted optimal portfolio for the long term.


A graph titled 'Expanding the Efficient Frontier with Farmland' comparing traditional and strategic investment portfolios. The y-axis shows annual expected return, and the x-axis shows risk measured by annual volatility. The graph features two curves: a dashed line representing the traditional portfolio excluding farmland, and a solid line representing the strategic portfolio including farmland. A shaded area indicates frontier expansion, with the strategic portfolio showing higher returns for the same risk level.