Asset Class Performance Overview (2001–2025)
This page provides a historical analysis of the performance of major private and public asset classes from 2001 to 2025. Using quarterly return data sourced from Preqin and global market indices, we examine:
- real (inflation-adjusted) returns vs volatility,
- cross-asset correlations, and
- annualized return profiles over time.
Dataset Overview
The model uses quarterly simple returns taken from the QuarterlyPerformance sheet of the Preqin export (2001–2025). The dataset includes 13 asset-class indices spanning private capital, venture capital, private debt, real estate, natural resources, infrastructure, and public-market benchmarks.
After cleaning the dataset and converting the date column into a proper time-series index, quarterly returns are compounded and annualized to compute annual performance measures, while quarterly covariances are scaled to annual frequency. Real returns are obtained by adjusting nominal annual returns for US consumer price inflation (CPIAUSCL).
All charts on this page reflect historical performance only and do not involve portfolio optimization or forward-looking modeling.
Real return vs volatility (US CPI-adjusted)
Real returns are computed by adjusting nominal annual returns for US consumer price inflation (CPIAUSCL). Each point represents an asset, with its average real return on the vertical axis and its year-to-year real-return volatility on the horizontal axis.
Cross-asset correlation
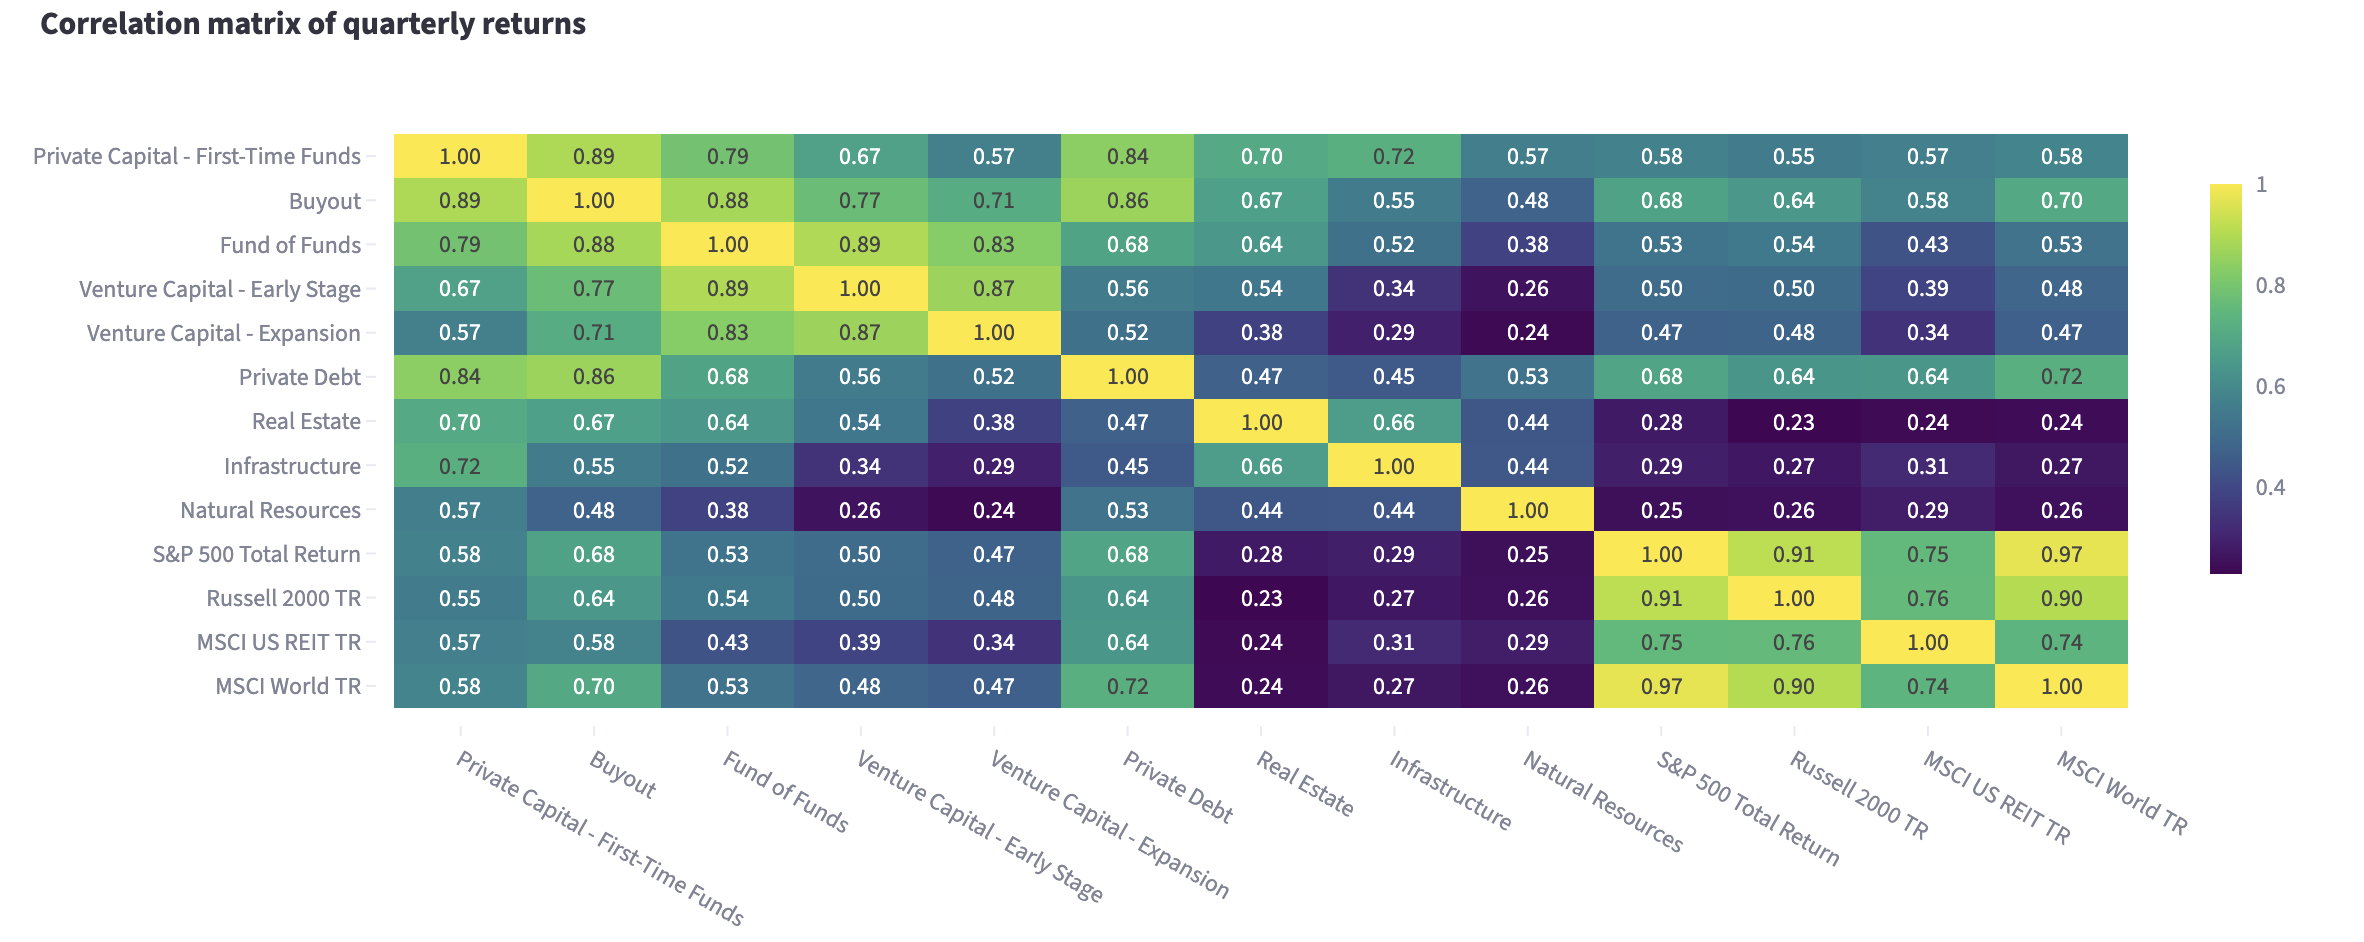
The heatmap displays the correlation matrix of quarterly returns across asset classes. Lower or negative correlations indicate stronger diversification benefits, while high correlations reflect similar behavior across economic cycles. Understanding these relationships helps illustrate which asset classes tend to move together and which provide diversification.
Annualized return profile by asset
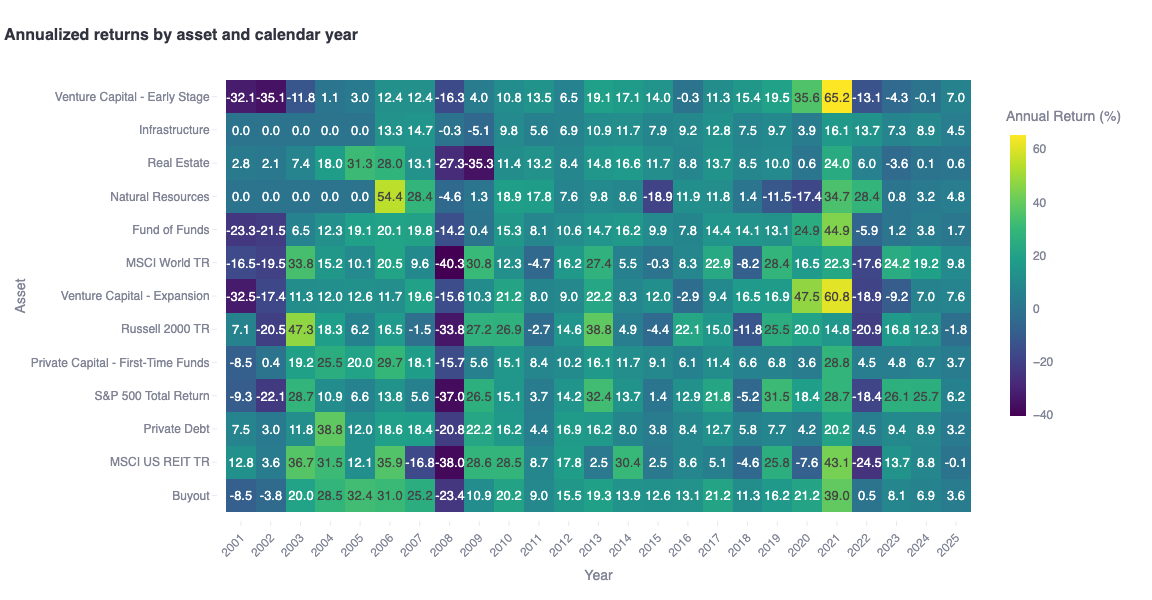
This heatmap displays the annualized return for each asset class and calendar year, based on compounded quarterly returns. Rows are sorted from the highest average annualized performer (top) to the lowest (bottom), making it easier to visually compare long-term performance trends, boom-and-bust cycles, and periods of exceptional outperformance or underperformance.
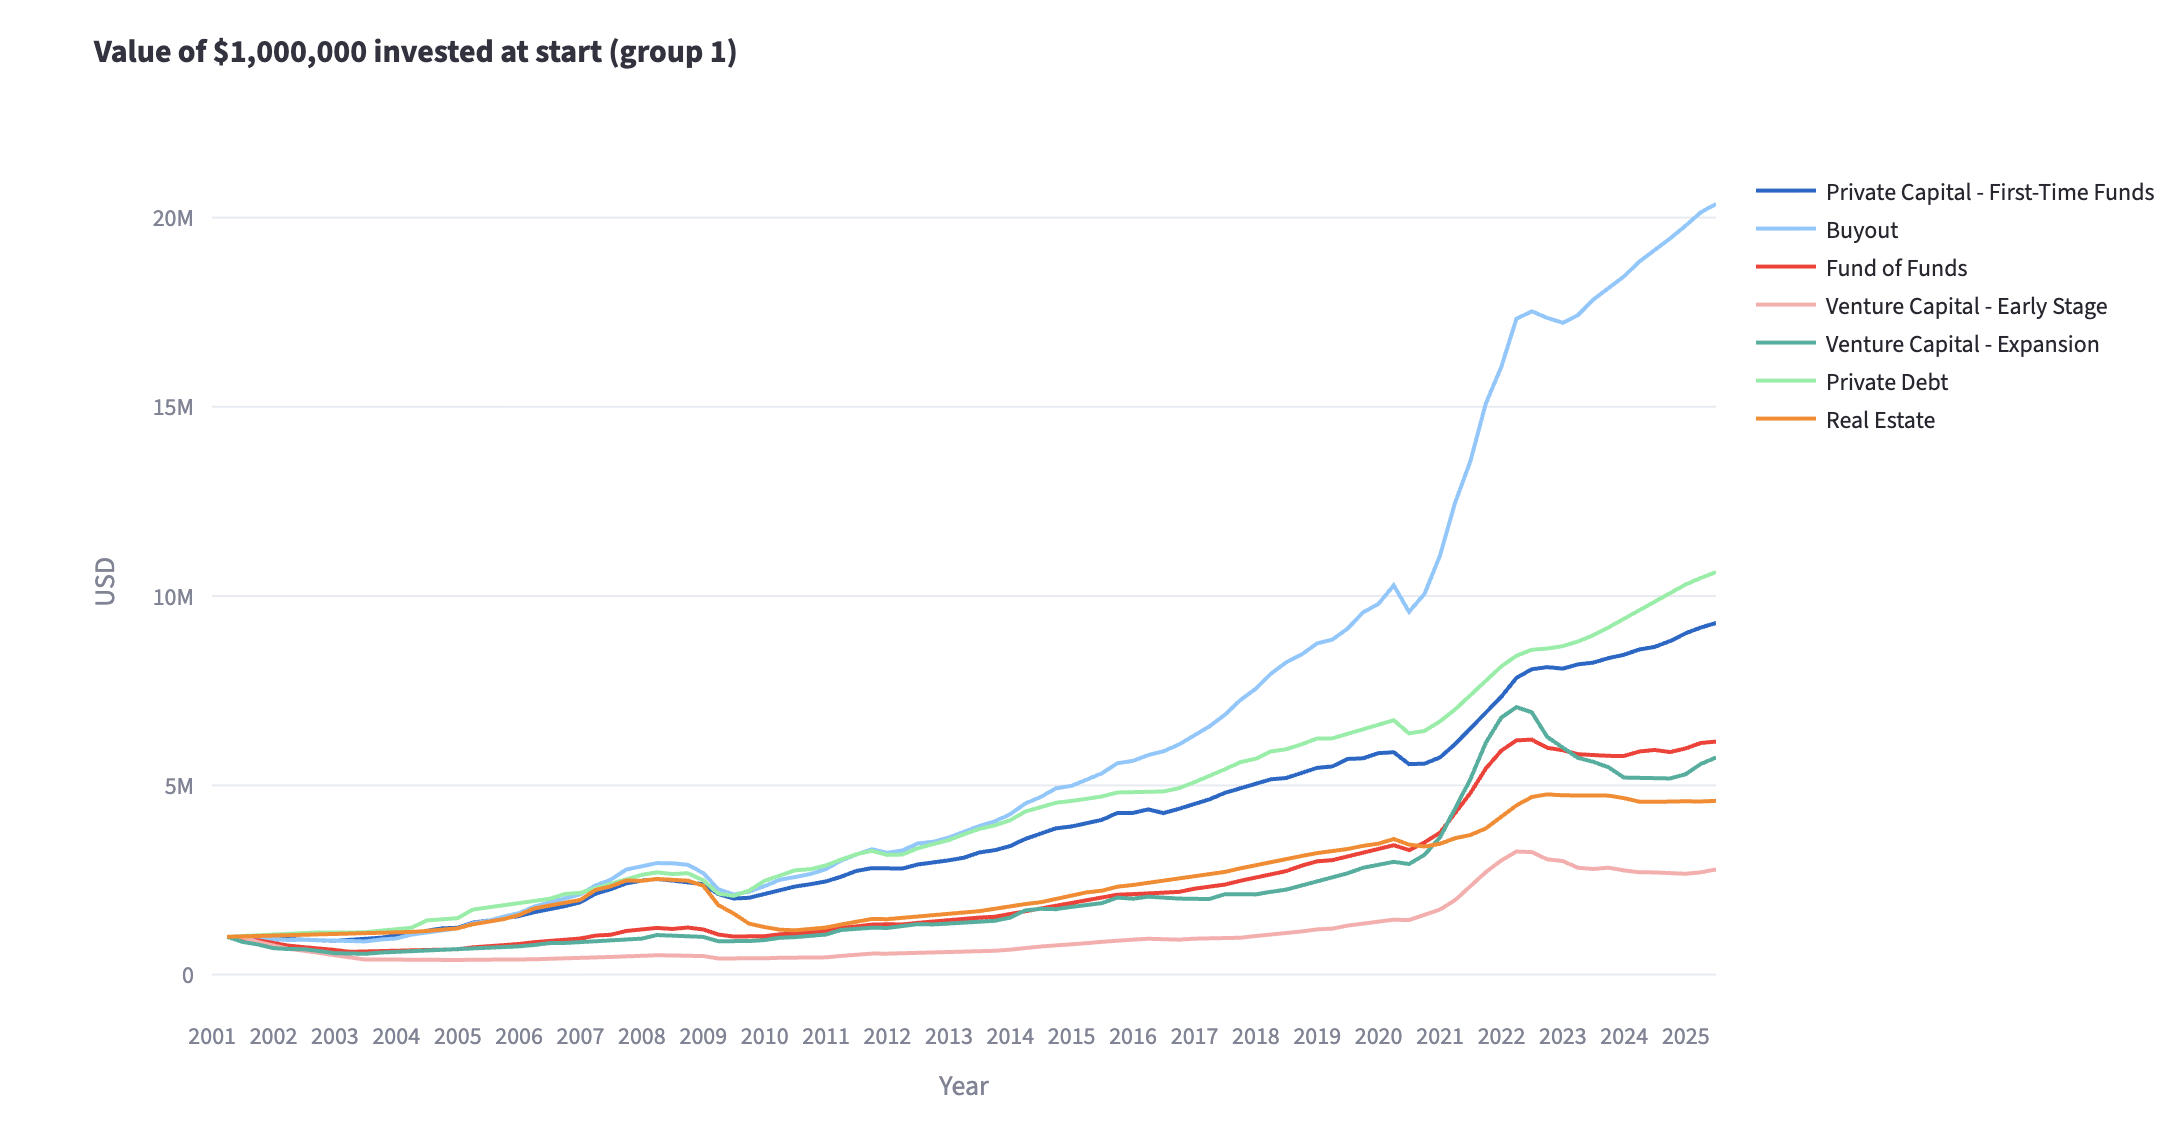
Asset Class Wealth Growth (Buy & Hold, 2001–2025)
The charts below illustrate the historical growth of capital across major private and public asset classes over the period 2001–2025, assuming a buy-and-hold investment strategy.
For each asset class, we simulate an initial investment of USD 1,000,000 made at the first available observation date for that asset. The investment is then held continuously until the end of the sample period, with returns compounded quarterly using historical total return data.
Asset Grouping
To improve readability and interpretation, asset classes are presented across two separate groups.
- Group 1 focuses primarily on private market strategies and real assets, including private capital, buyout, venture capital, private debt, and real estate. These asset classes typically exhibit lower liquidity, smoother reported return profiles, and performance patterns driven by valuation methodologies and underlying operating cash flows.
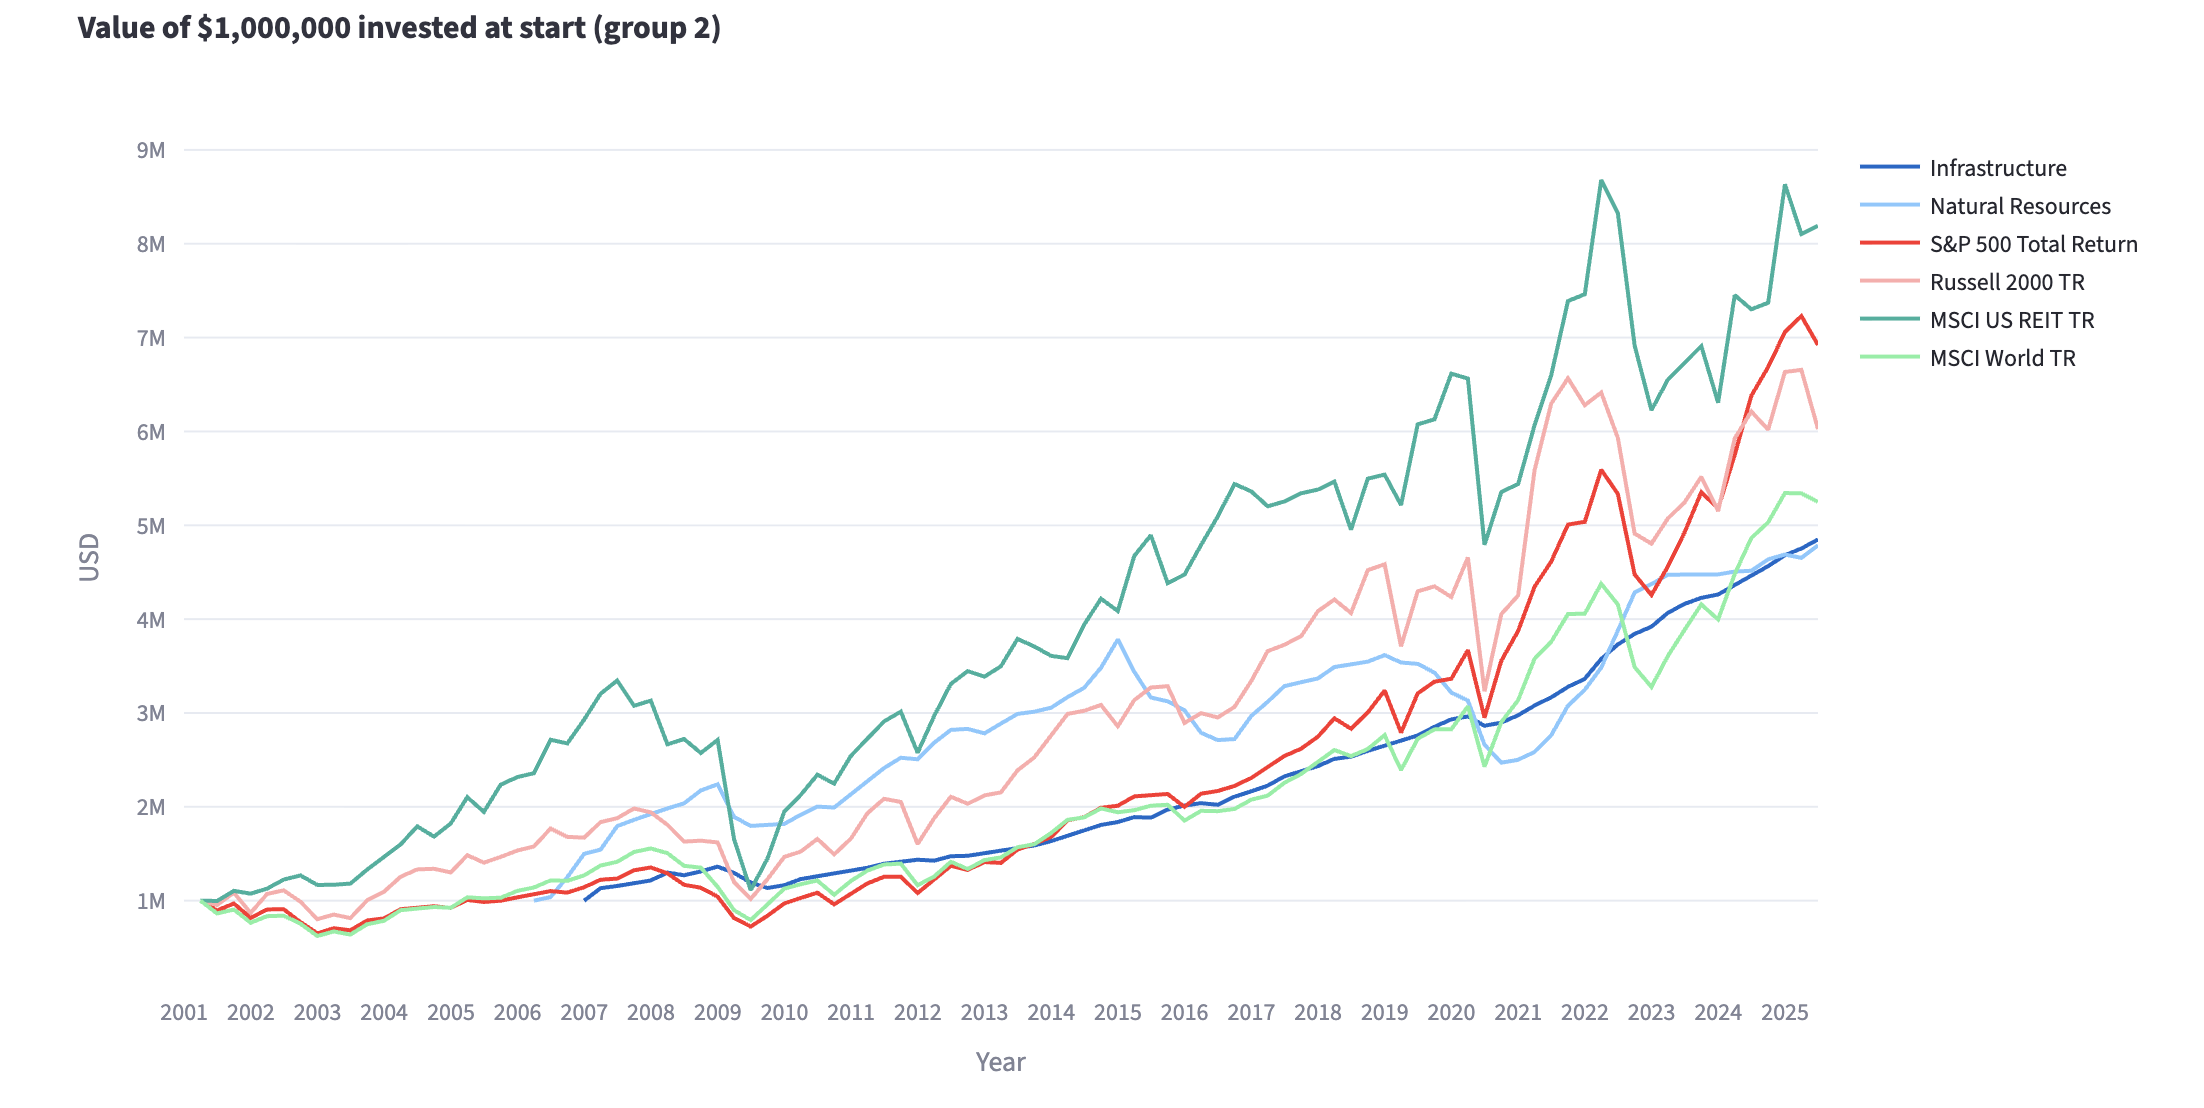
- Group 2 consists mainly of public market benchmarks and liquid real assets, such as listed equities, infrastructure, and natural resources. These asset classes tend to display higher short-term volatility and faster price discovery, reflecting continuous market pricing and greater sensitivity to macroeconomic conditions.
This grouping allows for clearer visualization of long-term wealth trajectories while preserving comparability within each group. The methodology used to compute wealth paths is identical across all asset classes.
Interpretation & Insights
The historical analysis highlights substantial dispersion in long-term outcomes across asset classes, reflecting differences in risk exposure, liquidity, valuation dynamics, and sensitivity to economic cycles. While private market strategies and real assets have delivered strong long-term capital growth, public market benchmarks exhibit greater short-term volatility and faster drawdowns and recoveries.
Taken together, these results underscore the importance of diversification across asset classes and investment styles when constructing long-term portfolios. Historical performance alone does not predict future outcomes, but it provides a useful framework for understanding how different asset classes have behaved across multiple market environments.